Assess Existing Physical and Virtual Desktop Environments
It is important to choose the correct user profile size for the Azure Virtual Desktop to avoid performance issues. The Azure Virtual Desktop user profile size can be determined from the existing environment in case a user is already using any other VDI platform
or physical devices. There are a few assessment tools available (i.e., Lakeside, EG innovations) that provide insight into your current IT environment by giving a thorough analysis of end-user activity and resource usage on the current VDI solution.
You can generate a VDI assessment report for the last few months to find out the resource usage on the existing VDI platform including CPU and RAM and accordingly finalize the Azure Virtual Desktop profile size for users. There might be different usages for each user, so group the users with different usage and finalized VM sizes for each group of users.
Assess Network Capacity and Speed Requirements for Azure Virtual Desktop
Azure Virtual Desktop performance is mainly dependent on network capacity as the session host will be running on the cloud platform. Azure Virtual Desktop uses Remote Desktop Protocol to provide remote display and input capabilities over network connections. RDP dynamically adjusts various parameters to deliver the best user experience based on the availability of computing resources and network bandwidth.
Two different network connections need to be considered while designing Azure Virtual Desktop architecture for better Azure Virtual Desktop performance:
•\ Azure Virtual Desktop client to Azure Virtual Desktop session host: It is recommended to place the Azure Virtual Desktop session host near the user location to get better performance. The user location and Azure Virtual Desktop region can affect the user experience as much
as the network conditions. Check out the Azure Virtual Desktop experience estimator (https://azure.microsoft.com/services/ virtual-desktop/assessment/) to find out the correct Azure region for specific users and the estimated round-trip time (RTT) from the user location to the Azure region. Additionally, the Azure Virtual Desktop user session always goes via Azure Virtual Desktop gateway, so you have to make sure that the Azure Virtual Desktop control planes (gateway, broker) are in the same region or a nearby region.
•\ On-premises to Azure bandwidth: This is important when there are applications hosted on an on-premises datacenter that need to be accessed via Azure Virtual Desktop. In this case, Azure to op-prem bandwidth (S2S/ER) is important, and the application bandwidth requirement needs to be considered to calculate the required bandwidth. See Figure 2-6.
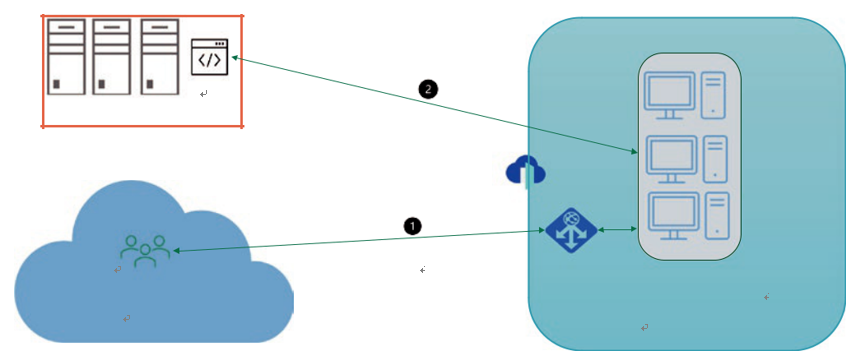
Figure 2-6. Azure Virtual Desktop network connections
It is difficult to predict bandwidth usage for Azure Virtual Desktop’s Remote Desktop Protocol because user activities generate most of the remote desktop traffic. Every user is unique, and differences in their work patterns may significantly change network use. The amount of data sent over the network via RDP depends on the user activity. For example, a user may work with Visual Studio Code to write code for a full day and consume minimal bandwidth, but then another user may use more bandwidth in less time by sending a 200-page print to the local printer.
The best way to identify network bandwidth requirements is to monitor real user connections by the built-in performance counters in Perfmon or by the network equipment. However, in many cases, you may be able to estimate network utilization by understanding how Remote Desktop Protocol works and by analyzing your users’ work patterns.
The Remote Desktop Protocol delivers the graphics generated by the remote server to display it on a local monitor. Sending a desktop bitmap is not simple task and requires a significant number of resources. For example, a 1080p desktop image in its uncompressed form is around 8 MB in size, and displaying this image on the locally connected monitor with the refresh rate of 30 Hz requires a bandwidth of about 237 MB/s. To reduce the amount of data transferred over the network, RDP uses the combination of multiple techniques like frame rate optimizations, screen content classification, content-specific codecs, progressive image encoding, and client-side caching.
When using a remote Windows session, your network’s available bandwidth greatly impacts the quality of user experience. Different applications and display resolutions require different network configurations, so it’s important to make sure your network is configured to meet your needs.
Table 2-1 lists the minimum recommended bandwidths for a smooth user experience.
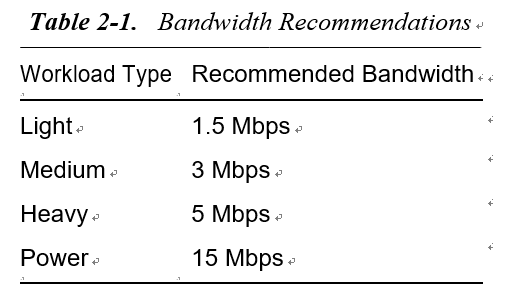
The bandwidth requirements may change depending on application workloads and your display resolution, voice or video conferencing, real-time communication, or streaming 4K video.